Why Inflation Will Likley Continue To Decline In 2024
Since the (largely) successful roll out of the vaccine in the first half of 2021, inflation emerged and became the most significant domestic economic story. More than two years later, the consensus view among economists is that prices are stabilizing and that above-target inflation will not persist much longer. Better economists than I am have written--and will continue to write--detailed analyses of the economic causes of this normalization, be they the easing of supply constraints, the tightening of monetary conditions, the withdrawal of fiscal stimulus, or some other cause or combination of causes. This piece will not do that. Instead, I will show in the next few paragraphs how the mechanical process of inflation measurement will likely drive a decline in the most widely reported numbers over the next few months.
How Inflation Is Measured
The term inflation means the change in prices over time. While it seems simple, determining a single number to describe this phenomenon is surprisingly difficult.
The first question that has to be answered is which prices. There are three main measures of inflation that are studied by macroeconomists1: the consumer price index (CPI), a price index derived from personal consumption expenditures (PCE), and the GDP deflator. This post is only concerned with the first two, as they are the most commonly cited by major news sources, and report monthly. Each reports a composite price, based on a weighted sum of different prices approximately representing the consumption pattern of typical Americans. For more than two decades, the Fed has prefered PCE for reasons detailed here, but because economics is an inexact science, it is important to look at as many sources of data as possible, so the CPI is still very important.
In addition, some goods' prices are largely determined by international financial markets, especially food and energy. Given the volatility of these price changes, it is important for policymakers to be able to look at how other prices change, so each of these indices reports an accompanying core change.
Keeping this in mind, at a minimum it is important to pay attention to the CPI, core CPI, PCE, and core PCE prices. That still leaves the question of which time. For a price index, an individual observation is largely meaningless, as they are reported as normalized to a certain, fairly random2 date. Then, each month, the inflation rate is reported over two periods: one month, and one year.
A Base Effects Curve
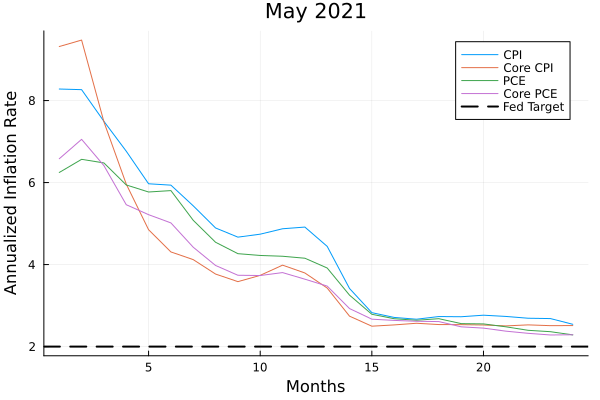
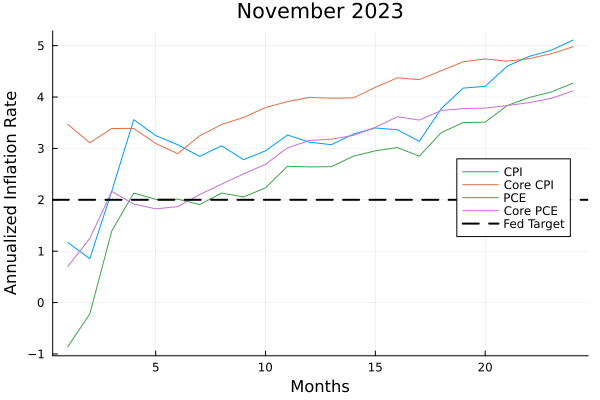
While each of these data points are meaningful, they miss much of the story of inflation. That is why economists frequently talk about "base effects," which specify how these two numbers capture price increases that happened during their observation windows. In the second half of 2023, these effects were often pointed to after each report showed a drastic fall in monthly inflation, but a slower decline in annual inflation. To visualize these effects, I constructed something I am calling, although it has no doubt been created and named by someone else, a base effects curve. In it, I plot the annualized rate of inflation at every month of measurement, from the previous month to the previous two years.
In this construction, it is similar to the yield curve, although it is undoubtedly less important. What it shows, however, is when price increases occurred. In this capacity, it shows how the most widely reported inflation numbers are likely to move in the next few months.
For example, as price increases started to accelerate towards the middle of 2021, the curve looked like this:

While the most recently reported inflation numbers, from November 2023, show a curve that looks like this:

The Slope of the Curve
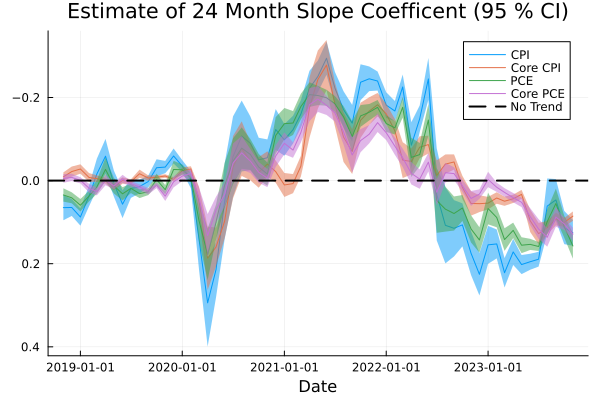
They are dramatically different pictures. To see how different they are, I estimated the slope of the curve each month based on an equal weighting of each inflation vintage. Then, after removing each month where I could not say with 95 percent confidence that the slope of the curve was different from zero, I plotted the observed slope against the annual rate of inflation six months in the future.

The correlation in the plot appears to show a negative relation between the slope coefficient and the annualized rate of inflation measured six months ahead. While I cannot emphasize enough that correlation is not causation, the logical explanation of this correlation makes sense.
What it would imply is that, when the slope of the curve is negative, as it was in May of 2021, price increases are recent, so measurements of inflation over longer periods will assume a slower average rate. Therefore, in the future, when the base price in is drastically lower than the current price, calculations of longer term inflation will be larger. In contrast, when the slope is positive, price increases were further in the past, so they will be expected to drop out of the range being calculated.
Evidence from this Current Inflationary Episode
Looking at the last five years, this slope coefficient tells a story reasonably similar to the one told by the dominant voices in economic coverage: The first signs of rapid price increases (likely counteracting the rapid price decreases at that followed the start of the pandemic) appeared in the first quarter of 2021, and persisted through the first three quarters of 2022; then, after a few months of largely stable inflation, prices increases began to slow through 2023. This is illustrated by flipping the y axis in the following plot.

With all four slope measures comfortably above zero--or at least as comfortably as any estimate with 24 highly correlated data points can be--it would then seem that the mechanical process of pushing out older observations will lead to lower inflation measures over the next few months.
What This Means
Since the first quarter of 2022, the Fed has raised interest rates by more than five percentage points. While robust consumer demand and clever government policy has kept this rapid hiking from having the disastrous effects some proponents of a hydraulic3 model of the maroeconomy foretasted (and in some case, seemed to hope for), it caused considerable strain to important sectors, and has negatively impacted vital investment plans. Therefore, it is in the interest of almost everyone for the Fed to loosen financial conditions before something too vital breaks. Unfortunately, the Fed's top priority is ensuring its own credibility, and as a result is loath to cut rates before it has absolute confidence that it has defeated this bout of inflation.
With this in mind, my hope is that the falling inflation rate I have predicted over the next few months will provide members of the FOMC with the surety they require to begin cutting interest rates before the end of the second quarter of this year.
Footnotes
The code to produce all of these graphs can be found here
This is something of a gross simplification.
Great care is taken in choosing the normalization date, but it is unimportant to this post
See this blog post